
My collection of Sample Size Calculators provides a set of simple-to-use JavaScript utilities for doing basic sample size calculations. I also provide some resources for calculating model-adjusted survival curves, in particular an S function and SAS code for direct standardization (aka the "corrected group prognosis" approach).
While I've got your attention, I'll take the opportunity to share some of my pet peeves, statistical and otherwise.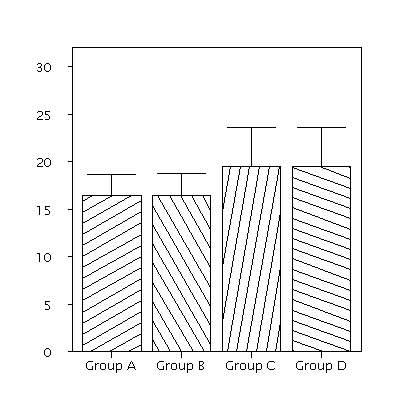
There appears to be no standard name for such plots. They are widely disliked in the statistical community, where they are sometimes referred to as dynamite plots (though I prefer pinhead plots as more descriptive). Faculty in Biostatistics at Vanderbilt University have gone as far as banning them altogether, stating:
Dynamite plots often hide important information. This is particularly true of small or skewed data sets. Researchers are highly discouraged from using them, and department members have the option to decline participation in papers in which the lead author requires the use of these plots..
This position is further supported at this web-page, which also provides a color display poster (Beware of Dynamite!) which ends with the following admonishment.Data are precious and usually expensive; treat them nicely. Respect them as individuals!
Post-hoc power calculations are usually conducted to help inform the interpretation of non-significant results. Confidence intervals provide a more sound and simpler approach. The advice section of Russ Lenth's power and sample-size page provides expanded discussion of this and other issues, in particular rather scathing criticisms of the use of the "effect size" approach to sample size calculation.
Lastly there's the issue of model interpretation. Many statistical models, such as proportional hazards models and logistic regression models are parameterized in such a way that model parameters are not directly interpretable. For example, it's hard to explain what an odds ratio really means (beyond the mathematical formula), unless one is dealing with rare outcomes, in which case they approximate the more easily understood relative risk.
I've helped author a couple of papers on the topic, but I've recently come across the efforts of a group of Harvard researchers who've made a concerted attempt to provide a general framework for doing this. Implementations of there idea exist in STATA (the Clarify program) and in R (the Zelig package). Please visit Zelig Project to learn more